EXPERIMENT NO.1
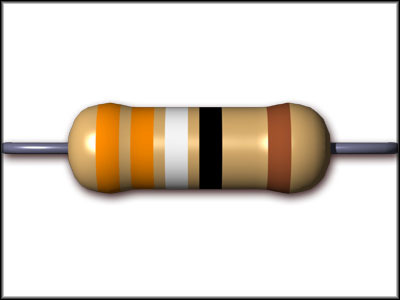
The first task that had to be done was to learn how to check the resistances of different resistors and know what there resistances are by using the Resistor Colour Code Chart. This chart will help you to decide what the resistance of different resistors by looking at the order of the stripes on that resistor for example if you see a gold or silver stripe which most resistors have this is there tolerance, this is always the last stripe to check. The chart that is used to check resistances is seen below. The chart is used so that the resistance can be calculated by looking at the chart. To find out the resistance of a resistor you look at the resistor so that the tolerance or the gold/silver stripe is on the right hand side this helps to make it easier to calculate the resistance, the first two or three stripes are the numbers to note, in most cases its only the first two stripe numbers that have to be noted, the next band is the multiplier this is how much the numbers need to be multiplied by . The last band is the tolerance this is how much the resistance can vary by from the what the resistors resistance is meant to be this is usually 5-10% or the gold or silver stripe. For example a resistor with the stripes brown, black, yellow and gold. This would mean that the number would be 10 then the multiplier would be x10,000 this would make the resistance 100,000 ohm's and the gold stripe would be how much this would actually vary. So the resistance could be as high as 105,000 ohms down to 95,000 ohm's. Then setting a multimeter to ohms you would then measure the resistance to make sure that the resistor is still good to use as if the resistor is not within these specifications then it is faulty and should not be used.

The first task that had to be done was to calculate how much resistance a resistor and calculate there tolerances, then measure the resistor with a multimeter to make sure the calculations were correct.
VALUE (COLOUR CODES) (VALUE MULTIMETER)
-56x100=5600 ohm's
tolerance=5% 5600x1.05=5880 ohm's 5.53k=5530 ohm's
5600x0.95=5320 ohm's
-10x10,000=100,000 ohm's
tolerance=5% 100kx1.05=105k ohm's 98.6k=98,600 ohm's
100kx0.95=95k ohm's
-27x10=270 ohm's
tolerance=5% 270x1.05=283.5 ohm's 266.2 ohm's
270x0.95=256.5 ohm's
-470x1=470 ohm's
tolerance=5% 470x1.05=474.7 ohm's 459 ohm's
470x0.95=446.5 ohm's
-10x1k=10,000 ohm's
tolerance=5% 10,000x1.05=10500 ohm's 9.84k=9840 ohm's
10,000x0.95=9500 ohm's
A bad reading whilst using the multimeter would be one that is completely different to the resistance that was calculated using the resistor chart or even if it is just out of the specification for the resistor this means that it is faulty and should not be used. For example if you had a 5600 ohm resistor but the reading you got for the resistor was 6000 ohm's you should not use it as it is not the correct resistance and could affect the operation of a circuit that it is in as it could be resisting to much current flow for example this would mean that another component may not operate properly as it is not getting enough current for it to operate this could be a transistor for example. However all the readings that were taken down for this experiment where good as they were all within specification.
The next part of the experiment was to choose to resistors with different resistances and measure them with the multimeter so that exact resistance can be known.
Resistor 1: 5530 ohm's Resistor 2: 9840 ohm's
Then the resistors where put in series and the resistance was calculated then the total resistance was measured.
Calculated value 1 and 2 in series : RT=R1+R2: 5530 + 9840 = 15370 ohm's
Measured value 1 and 2 in series : 15490 ohm's
Next the resistors where wired up in parallel this is done by twisting the ends of the resistors together then the resistance was calculated and then measured.
Calculated value 1 and 2 in parallel: 1/RT=1/R1+1/R2+1/R3: = 3549 ohm's
Measured value 1 and 2 in parallel: = 3420 ohm's
What principles of electricity have been demonstrated with this? Explain
The purpose of the resistor is to reduce current flow so that damage does not occur to components in the circuit. The value of a resistor means how much effort is required to push through it, e.g the higher the resistance the greater the effort required to get through the resistor. When two or more resistors are wired up in series the total resistance is added together from each resistor to make the overall resistance resistance in that circuit this can be worked out using this equation, RT=R1+R2+R3. If the resistors are wired up in parallel then the total resistance of the circuit is lower than the lowest valued resistor.This is because high amperage is required to give each component there own power source so low resistance is needed to achieve this high amperage.
EXPERIMENT 2
Diodes
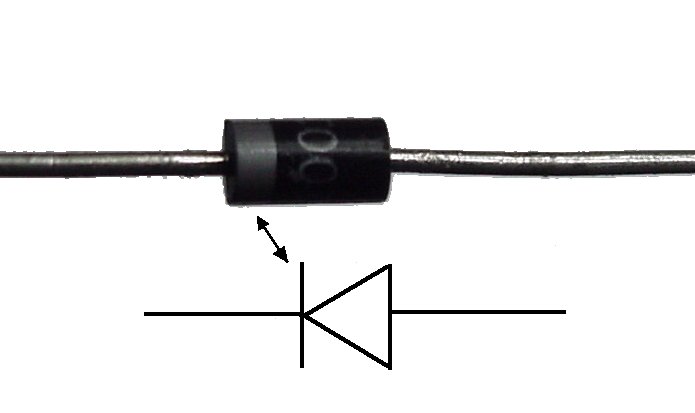
The purpose of a diode is to allow current to flow in only one direction which is forward bias, if current tries to flow the other way it will incounter a binary layer that prevents current from flowing in the wrong direction. This circuit could be used to convert alternating current into direct current. This is used on alternators which produce alternating current, it is then turned into direct current so that the battery can receive charge as if the battery received alternating current it would not charge as the voltage would simply exit the battery again just after it entered the battery. All diodes required 0.6 volts to turn on and allow current to flow in the circuit and in the desired direction

-An insulator when current tries to flow in one direction
-A conductor when current flows in the direction
Exercise: Using a multimeter, identify the anode and cathode of the diode and the LED
Voltage drop in forward Biased Direction. | Voltage drop in reverse biased direction | |
LED | ||
Diode |
Explain how you could identify the cathode without a multimeter
On an LED the anode or positive leg is always longer than the cathode or negative leg. On a normal diode the cathode or negative side has a stripe on it so that the polarity of the diode can be known this is the only way to identify the anode and cathode side of the diode. If the legs have been cut on the LED and are the same length then look at the top of the LED and you will see a flat side this is the negative side of the LED.

Exercise: For Vs=5v, R=1k ohm's, D=1N007 build the following circuit on a breadboard.

Calculate first the value of current flowing through the diode, now measure and check your answer?
show your working.
Calculated Measured
-I=V/R 0.0045Amps
-I=5v/1000 ohm's=0.005Amps
Is the reading as you expected; explain why or why not?
-Yes the reading is what was expected as ohm's law was used to calculated the amperage (I=V/R) and the amperage is low because of high resistance from the circuit being wired up in series.
Measure the voltage drop across the diode. (can not calculate it as ohm's law cannot be used to calculate)
-Measured
0.672 volts
What is the maximum value of the current that can flow through the given diode?
-The diode can handle 1.0amps max at 75 degrees celcuis, this value can be greater when the diode is at lower temperatures.
For R=1k ohm's. What is the maximum value of Vs so that the diode operates in a safe region?
-Any voltage that is 999.4 volts or less as the diode can only handle 0.6 volts and the resistor and can consume the rest of that voltage.
Replace the diode by an LED & calculate the current, then measure and check your answer?
Calculated Measured
I=V/R 0.003Amps
I=3.2volts/1000 ohm's
I=0.0032 Amps
What do you observe? Explain Briefly.
-The LED requires a high voltage to turn on, as opposed to the diode. This means that current is lower as more load is on the circuit to push current through the LED to switch it on. And since the diode requires less voltage to turn on this puts less load on the circuit and hence current flow is higher.
Things that can go wrong with diodes is that they can be overloaded with either to much voltage or to much current or both. When this happens the diode creates an open circuit so current cannot flow this means that the circuit that the diode is in will not operate if the circuit is in series.
EXPERIMENT No.3


Exercise: Obtain a breadboard, suitable components from your tutor and build the above circuit.
For R=100 ohm's and RL=100 ohm's, Vs= 12v
What is the value of Vz
-Vz is 4.96volts, this is the voltage drop when the power supply is at 12 volts.
Vary Vs from 10v to 15v
what is the value of Vz
When the voltage was at 10v the value of Vz or the voltage drop across the zener diode was 4.84 volts, when the voltage was at 15v the value of Vz is 5.02 volts.
Explain what is happening here
as the voltage is increased or decreased the voltage regulated by the zener diode remains around the same only varying by 0.2 volts, this is a normal reading as the zener diode is a 5v diode and is only designed to let that amount of voltage through. If the voltage had gone upto the supply voltage or near the supply voltage eg 8 volts or more, this would indicate that the zener diode is blown and has now become a consumer and uses all the available voltage and does not remain a regulator like it was designed to and it would need to be replaced. The zener diode could have blown by being overloaded with to much voltage as there may not have been another consumer to share the voltage. Or a resistor that had to low resistance and there was more current than what the diode could handle.
What could the circuit be used for?
the circuit could used to help regulate voltage so that certain components get the correct voltage and dont get to much voltage that could overload a component by consuming some of the power depending on what the zener diode is rated to for example the zener diodes that we are using are only rated to 5v so thats what they will consume
Reverse the polarity of the zener diode.
What is the value of Vz? Make a short comment why you had that reading.
Vz is 0.6 volts now that the zener diode is now wired up in forward bias, this is because it has turned into a normal diode now and less voltage is required to push through the binary layer, the resistor will now consume the remaining for example if the supply voltage was 12v then the resistor would consume 11.4 volts and the remaining 0.6 volts would be for the diode.
EXPERIMENT No.4
The purpose of a zener diode is to allow current to flow in a forward bias direction and a reverse bias direction. In the forward bias direction the zener diode works just like a normal diode allowing current to flow one way and requiring 0.6volts to turn on. When the zener is wired up in the reverse biased or the wrong way for normal diodes, the zener requires more voltage to switch on, this will depend on the zener but for example 5volt zener would switch on and allow current to flow when the voltage reaches 5 volts. Zener diodes are used to regulate voltage in circuits that required small voltage supplies. Or they can be used to prevent voltage spikes for example in the ECU when the fuel injector fires a voltage spike occurs that could damage a lot of components that only require small voltages so the zener diode acts as protection to these components
Components: 1 x resistors, 1 x5V1 400mW Zener diode, 1 x Diode 1N4007
Exercise: Obtain a breadboard, suitable components from your tutor and build the following circuit.
Vs=10 & 15v, R=1k ohm's

10 Volts 15 Volts
Volt drop V1: 4.63 volts 4.804 volts
Volt drop V2: 0.667 volts 0.7 volts
Volt drop V3: 5.302 volts 5.50 volts
Volt drop V4: 4.87 volts 9.88 volts
Calculated current A: I=V/R I=V/R
I=10v/1000 ohm's I=15v/1000 ohm's
I=0.01 amps I=0.015 amps
Describe what is happening and why you are getting these readings:
Voltage drop does not change much across the zener diode (V1) these are good readings as it shows that the zener diode is working properly since the diode is designed to consume 5.1v, as long as the resistors consume the rest of the voltage then the zener diode will consume the remaining 5v or there abouts as this is the voltage required to push through the binary layer to allow current to flow. A bad reading would be one where the zener diode is consuming most or all of the voltage as this means that the diode has blown and it has turned into a consumer as opposed to a voltage regulator and only consuming some of the voltage now it will consume all of the voltage.
Voltage drops across the diode (V2) remain roughly the same around 0.6-0.7 volts as this is the voltage required to turn on the diode and allow current to flow this is a good reading, if the diode got any more voltage than this then the diode would blow and the circuit would become open circuit and will not operate or turn on as current cannot flow this would be a bad reading or result.
The voltage drop across the zener diode and the normal diode(v3) combined remains roughly the same as both are only designed to consume a set amount of voltage so this reading is good as both diodes are working properly and are consuming the correct amount of voltage that is shared between them. A bad reading would be open circuit as this would mean that the diode has blown as the zener diode or the resistor may not be working properly.
The biggest change in voltage drops was across the resistor (V4) as this has to consume the remaining voltage that cannot be consumed by the diodes, so as the voltage increased from the power supply there was a greater voltage drop across the resistor as it had to consume more voltage so that the diodes could operate under the correct amount of voltage. This means that the readings are good and are to be expected, if the reading was open circuit this would be a bad reading as this could mean that the resistor was faulty and did not lower the voltage and amperage enough so the diodes blew with to much amperage and to much voltage.
Experiment No.5
The Capacitor
The purpose of a capacitor is to store voltage or energy that can be used later on in a circuit, for example a ignition system for a basic motor. The capacitor stores positive voltage from the available voltage or power source and stores it on a negative plate, the capacitor cannot store this energy for a long time however as there is a gradual grounding of electricity and the charge would be slowly lost over time.


Capacitor Charging Circuit
Components: 1 x resistor, 1 x capacitor.
Exercise: First, calculate how much time it would take to charge up the capacitor. Then, connect the circuit as shown above. Measure the time taken by the capacitor to reach the applied voltage on an oscilloscope. Fill in the chart below. Also draw the observed waveforms in the graphs below, filling the details on each one.
Circuit number | Capacitance (uF) | Resistance (KΩ) | Calculated Time (ms) | Observed Time (ms) |
1 | 100 | 1 | ||
2 | 100 | 0.1 | ||
3 | 100 | 0.47 | ||
4 | 330 | 1 |
Calculated time calculations:
(1) 1000 ohm's x 0.1 Farad x 5 = 500ms
(2) 100 ohm's x 0.1 Farad x 5 = 50ms
(3) 470 ohm's x 0.1 Farad x 5 = 235ms
(4) 1000 ohm's x 0.33 Farads x 5 = 1650ms
These are good readings as most of the capacitors charge up in the calculated time, however circuit number 3 nearly took twice as long as the calculated time to charge this could have been caused by a faulty connection in the circuit, where contacts weren't very strong meaning there was more resistance in the circuit than what there was meant to be meaning that there was less current flow so the capacitor took longer to charge up.
(x and y axis values per division given beside photos)
Circuit 1: (10volts y axis)-(1sec x axis)
 (10volts y axis)-(1sec x axis)
Circuit 2: (10 volts y axis)-(100ms x axis)
 (10 volts y axis)-(100ms x axis)
 Cicuit 3: (5volt y axis)-(500ms x axis)
 (5volt y axis)-(500ms x axis)
Circuit 4: (5volt y axis)-(500ms x axis)
 (5volt y axis)-(500ms x axis)
How does changes in the resistor affect the charging time?
-The lower the resistance from lower valued resistors means there is greater current flow which means the capacitor can charge up quicker, if the resistance from the resistor is higher then current flow is lower this means it would take longer for the capacitor to charge up.
How does changes in the capacitor affect the charging time?
-The greater the capacitance of the capacitor or how much charge the capacitor can store the longer the charge time required to fully charge the capacitor, as it can store a larger amount of charge. This means there is longer charge time between the 100 micro farad capacitor and the 330 micro farad capacitor as the 330 can store more.
EXPERIMENT No.6
Meter Check of a Transistor
The purpose of a transistor is to switch on high voltage and current flow for high powered consumers e.g light bulbs in which the current flows the the collector to the emitter, using small amperage and voltage from the base to the emitter to switch on the high current flow from the collector. The transistor works a bit like a relay using small amperage to turn on high amperage.
Bipolar transistors are constructed of a three-layer semiconductor “sandwich,” either PNP or
NPN. As such, transistors register as two diodes connected back-to-back when tested with a
multimeter’s “diode check” function as illustrated in the diagram below. Low voltage readings on the base with the black negative (-) leads correspond to an N-type base in a PNP transistor. On the symbol, the N-type material corresponds to the “non-pointing” end of the base-emitter junction, the base. The P-type emitter corresponds to “pointing” end of the base emitter junction the emitter.

Transistor Symbol and semiconductor construction shown below.
Identify the legs or terminals of the transistor with a multimeter.
Diode test (V) meter readings | ||||||
Transistor number | VBE | VEB | VBC | VCB | VCE | VEC |
NPN | ||||||
PNP | ||||||
These readings are good as it shows that the transistor is working properly, if the transistor was showing open circuit (O.L) through out the test this would be a bad reading as this would indicate that the transistor has blown this could have been caused by overloading the transistor with to much current or to much voltage. The most likely place the transistor would have overloaded from on a NPN transistor is the base to the emitter, since the transistor acts like a relay using small current to switch on large current, the base to emitter could have had to small of a resistor and the switching side of the transistor could have had to much current and blown leaving the transistor useless.
EXPERIMENT No7
Transistor as a switch
Components: 1 x small signal NPN transistor, 2 resistors
Connect the multimeter between base and emitter.
Note the voltage reading and explain what this reading is indicating.
-The Voltage drop across the base to the emitter was 0.798 volts, this reading is good as its shows that the transistors switching side is working properly as this side of the transistor requires 0.7-0.8 volts to switch on the high power side or high current flow side of the transistor which flows from the collector to the emitter this allows for components like LED's or light bulbs to be switched on as they require high current flow. A bad reading would be O.L (open circuit) is it would indicate that the transistors switching side has blown which could have been caused by to much voltage or to much amperage and overloaded the transistors switching the side this would mean that the transistor would have to replaced.
Connect the multimeter between the collector and the emitter.
Note the voltage reading and explain what this reading is indicating.
-The voltage drop across the collector to the emitter was 0.054volts, this is a good reading as it shows that the switching side of the transistor is in the saturated region or is fully turned on with enough current flowing from the base to the emitter to effectively switch on the high power side of the transistor from the collector to the emitter, if the switching side of the transistor does not get adequate current flow then the high power/high current flow side of the transistor is not turned on properly. This means that there is a higher voltage drop across this area to keep current flowing kind of like a poor electrical connection that causes resistance to current flow, so the more current flow through the switching side of the transistor means more voltage and more current is able to flow through the high power side of the transistor as it has a stronger connection and less resistance so voltage and current can easily flow. Since the collector to the emitter acts as connection or wire there should be no resistance or little resistance to current flow so that the high power consumers can work properly. A bad reading would be one where there was high voltage drop as this means that the switching side of the transistor is not working properly and voltage is being used up to try and keep current flowing this means that the high power consumers such as LED's dont get enough voltage and current to work properly if at all as some of the supply voltage is being used up to get through the transistor. Another bad reading would be O.L (open circuit) as this would mean that the switching side of the transistor is faulty and will not allow current to flow from the collector to the emitter as it could have been overloaded. This would mean that the transistor would have to be replaced.
In the plot given below what are the regions indicated by the arrows A & B?
How does a transistor work in these regions? Explain in detail:
-The area that is marked A is the area when the transistor is known as being saturated or fully on, this means that there is enough current flowing from the base to the emitter to allow current to freely flow from the collector to the emitter. This means that there is no voltage drop across the collector and emitter as no voltage is required to keep current flowing through this area and the high powered consumers get the full current flow and voltage that they require. The area marked B is the cut-off area this means that there is not enough current flowing from the base to the emitter to allow current to flow from the collector to the emitter this basically means that the transistor is turned off so the circuit that the transistor is on is also turned off as current cannot flow through its circuit until the transistor is turned on
What is the power dissipated by the transistor at Vce of 3 volts?
-(Base to emitter) : P(power/watts)=V(volts)xI(current)
P = 3 x 0.005 = 0.015watts
-(Collector to emitter) : P = V x I
P = 3 x 0.013 = 0.039 watts
What is the Beta of this transistor at Vce 2,3 and 4 volts?
Beta=gain
Beta = Ic(current through collector)/Ib(current throught Base)
Beta = Ic/Ib
- 2 volts = 21mA/0.75mA = 28
3 volts = 14mA/0.5mA = 28
4 volts = 7mA/ 0.2mA = 35
EXPERIMENT no.8
Summary: Vary the base resistor and measure changes in voltage and current for Vce, Vbe, Ic and Ib. Then plot a load line.
Set up the following circuit on a breadboard. Use a 470R for Rc and a BC547 NPN transistor.


Record here:
Rb 4.39v Vbe 0.696v Vce 0.697v Ib 21.1 uA Ic 5.37mA (221k ohm's)
Rb 4.689v Vbe: 0.754v Vce: 47.4mV Ib: 461.6uA Ic: 6.92mA (1k ohm's)
Rb 4.821v Vbe: 0.668v Vce: 2.444v Ib: 8.3uA Ic: 2.16mA (560k ohm's)
Rb 4.653v Vbe: 0.757v Vce: 43.7mV Ib: 562uA Ic: 6.95mA (8.17k ohm's)
Rb 4.716v Vbe: 0.673v Vce: 2.217v Ib: 10uA Ic: 2.60mA (467k ohm's)
-The different sized resistors at Rb meant that there was either more current flowing from the base to the emitter when the resistor is smaller, or less current flowing through the base to the emitter when a larger resistor is used. This will affect how well the transistor is switched on, if the transistor is not very switched on i.e. there is only a small amount of current flowing from the base to the emitter then this means that a voltage drop will occur across the collector to the emitter as there is resistance in the transistor and some voltage has to be used up in order to pass through the transistor. The greater the voltage drop the less switched on the transistor is and this means that the transistor is not in the saturated region when a voltage drop occurs, when there is a small voltage drop for this experiment it was 0.047volts as this circuit had the smallest resistor for Rb this means that the transistor is in a fully saturated or switched on region almost no voltage is required to keep current flowing through the circuit. But when the voltage was at 2.4 volts for this experiment it shows that the transistor was in the active region but it was not saturated so a large voltage is required to keep current flowing through the circuit. This change in voltage drop across the collector to the emitter was caused by the change in resistance at Rb, as more resistance to current flow was added through the base to the emitter the less current could flow this meant that the transistor could not operate in the saturated region. And voltage drops occurred
Discuss what happened for Vbe during this experiment. What change took place if any, and what caused the change?
-The voltage across the base to the emitter does not change very much as this part of the transistor is like a diode, and it only requires 0.6-0.7 volts to turn on the high powered side of the transistor from the collector to the emitter. However it would current flow through this part of the transistor that would be affected. This is a good reading as it shows that the switching side of the transistor is working properly, a bad reading would O.L (open circuit) as this would indicate that the transistors switching side has broken most likely from being overloaded, from to much voltage or to much amperage.
Discuss what happened for Ib during this experiment. What change took place, and what caused the change?
-Current flow through the base was affected by the size of the resistor used at Rb, if a larger resistor was used this means that there is more resistance to current flowing through the base so there is less current flow. When there is less current flowing through the base of the transistor this means that the transistor is most likely not in the saturated region and this means that a voltage drop would be occurring across the collector to the emitter to keep current flowing. When a smaller resistor was used at Rb there was less resistance to current flowing this meant that the transistor could be more saturated or switched on and there would be minimal voltage drop across the collector to the emitter. This means that there is more voltage and current available to the high powered consumers as it is not being used up in getting through the collector. These readings are all good as they show that the transistor is working properly and as expected. A bad reading would be one where there is no current flowing through the base, possibly caused by the transistor being overloaded with to much voltage or amperage. Another bad reading would be low amperage though the base even though a small resistor is being used this could indicate a faulty transistor that has poor connections and is causing internal resistance to current flow. In both cases the transistor would have to be replaced.
Discuss what happened for Ic during this experiment. What changes took place, and what caused the change?
-The change in size of resistors at Rb meant there was either more or less restriction to current flow through the base to the emitter. When a larger resistor is used this means that there is more restriction to current flowing through the base which means the transistor is not saturated or fully switched on and there is resistance to current flow in the collector hence the low amperage through the collector. However when a smaller resistor was used at the base this meant more current could flow through the base which meant that the transistor is more saturated or switched on and current could flow through the collector much more easily now. These readings are good as they where expected. Bad readings would be low amperage flow through the collector even if a small resistor is being used for the base, this would indicate a poor connection which is causing resistance and the transistor would have to be replaced.
Plot the points for Ic and Vce on the graph below to create a load line. Plan the values for so you use up the graph space. Use Ic as your vertical value, and Vce as your horizontal value. Using Vbe on the Vce scale, plot the values of Ib.

-Beta = Ic/Ib
-Beta =6/0.2
-Beta=30
Explain what the load line graph is telling you. Discuss the regions of the graph where the transistor is saturated, cut-off, or in the active area.
-The load line is telling us the relationship between the current flowing through the base to the emitter and how that will affect the current flowing through the collector and what the voltage drop across the collector to the emitter will be. The saturated region of the transistor is on the left hand side of the graph from the top of the load line to just above the cut-off area from about 4mA and above on the Ic side. As this shows a low voltage drop across the collector to emitter. The transistor is saturated or fully switched on when the current flowing from the base to the emitter is above 0.4mA. The active region for the transistor is any area above the cut-off region, as this shows that there is current flowing through the base to the emitter but in most cases not enough to fully switch on the transistor and so there can be high voltage drops across the collector to the emitter. So this shows that the transistor is on but is not operating efficiently. The cut-off region is the area where there is not enough current flowing through base to the emitter to allow current to flow from the collector to the emitter. This means that transistor is off as no current can flow through the high power side of the transistor.
REFERENCE
http://www.tech-faq.com/wp-content/uploads/images/Resistor.jpg(resistor image)
http://diyaudioprojects.com/Technical/Electronics/resistorcodes.jpg (resistor chart)
http://www.markallen.com/teaching/images/electronics/diode.jpg(diode symbols)
wiring diagram for experiment 2,3,4,7 and 8 from unitec labwork book
multimeter checking transistor image from unitec labwork book
transistor symbol and semiconductor construction image from unitec lab work book
transistor load line chart from unitec lab work book
http://www.cartft.com/image_db/1n4001.jpg(diode image)
http://9circuits.com/wp-content/uploads/wpsc/product_images/Red_led_x5-2.jpg(LED image)
http://upload.wikimedia.org/wikipedia/commons/e/e9/Zener_3D_and_ckt.png(zener diode image)
http://www.solarbotics.com/assets/images/cp3300uf/cp3300uf_pl.jpg(capacitor image)
http://www.opamp-electronics.com/catalog/images/MPS3904_40V_100mA_NPN_Switching_Transistor_007204.jpg(transistorimage)
No comments:
Post a Comment